This infographic of the NIH’s 2019 Monitoring the Future survey highlights drug use trends among the Nation’s youth for marijuana, alcohol, cigarettes, and prescription drugs.
View the Animated Version
For more information on MTF 2019 Survey findings specific to Vaping: archives.nida.nih.gov/related-topics/trends-statistics/infographics/monitoring-future-2019-survey-results-vaping
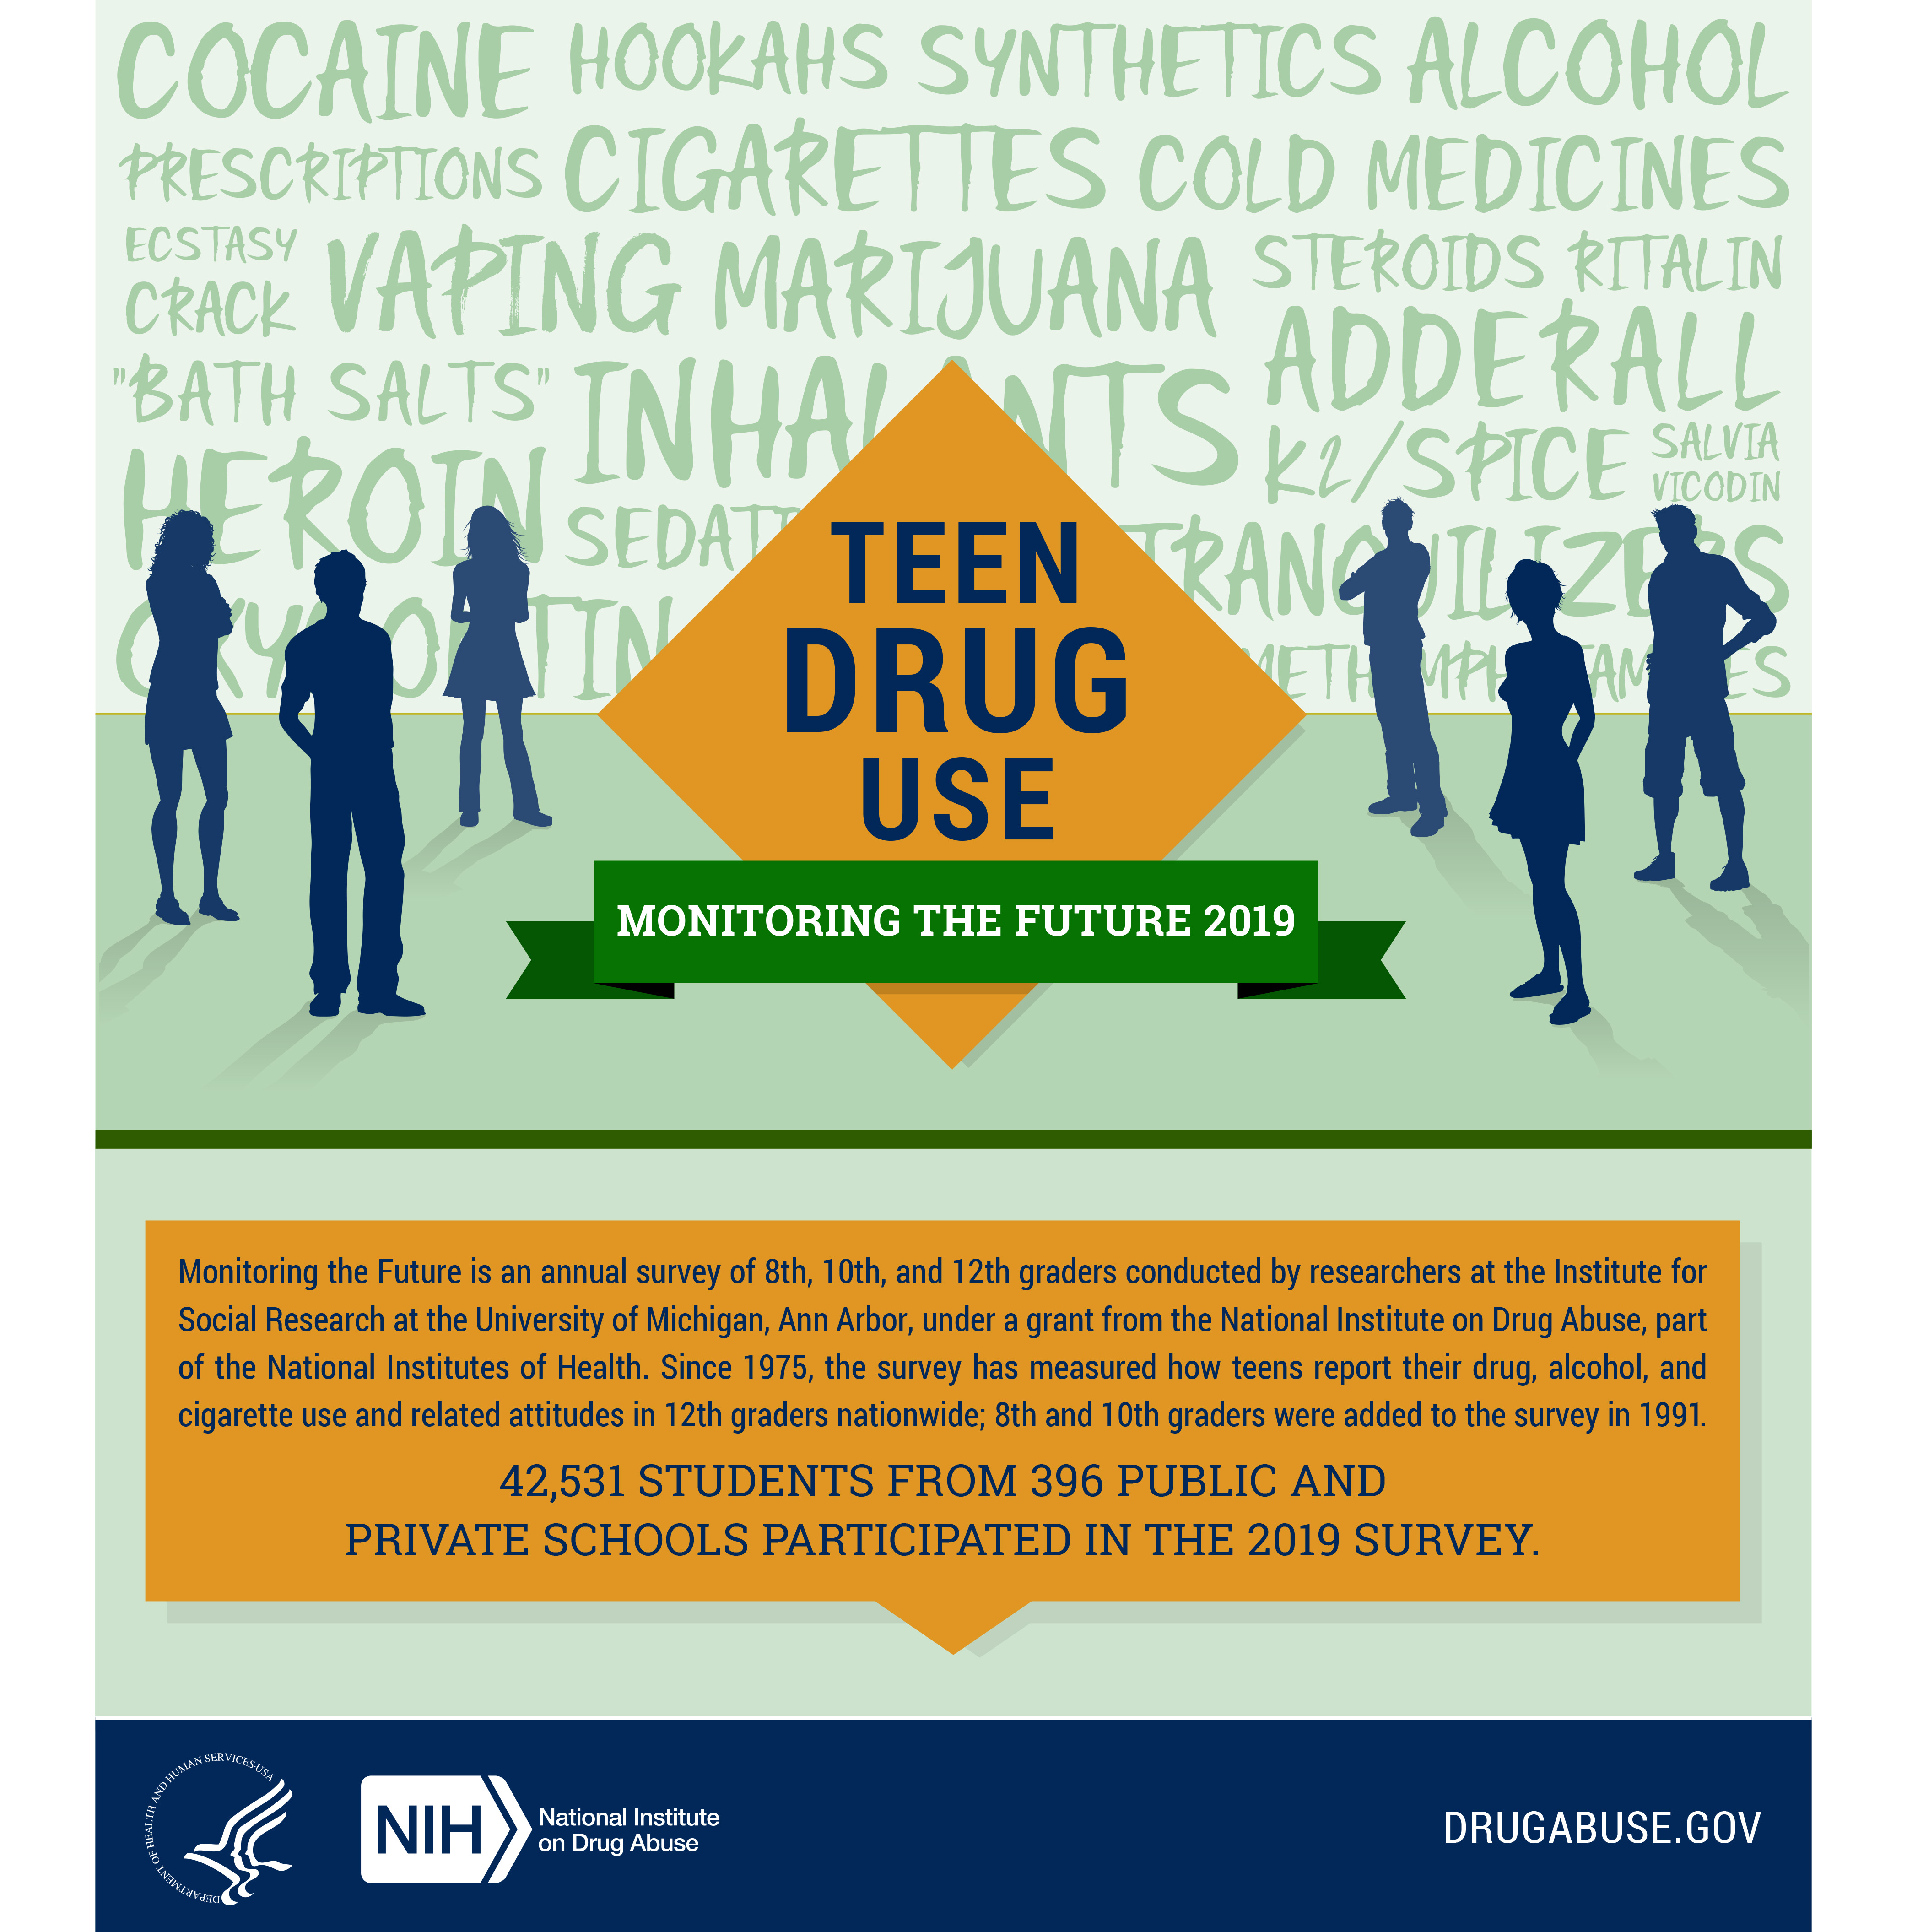
Monitoring the Future is an annual survey of 8th, 10th, and 12th graders conducted by researchers at the Institute for Social Research at the University of Michigan, Ann Arbor, under a grant from the National Institute on Drug Abuse, part of the National Institutes of Health. Since 1975, the survey has measured how teens report their drug, alcohol, and cigarette use and related attitudes in 12th graders nationwide; 8th and 10th graders were added to the survey in 1991.
42,531 Students from 396 public and private schools participated in the 2019 survey.
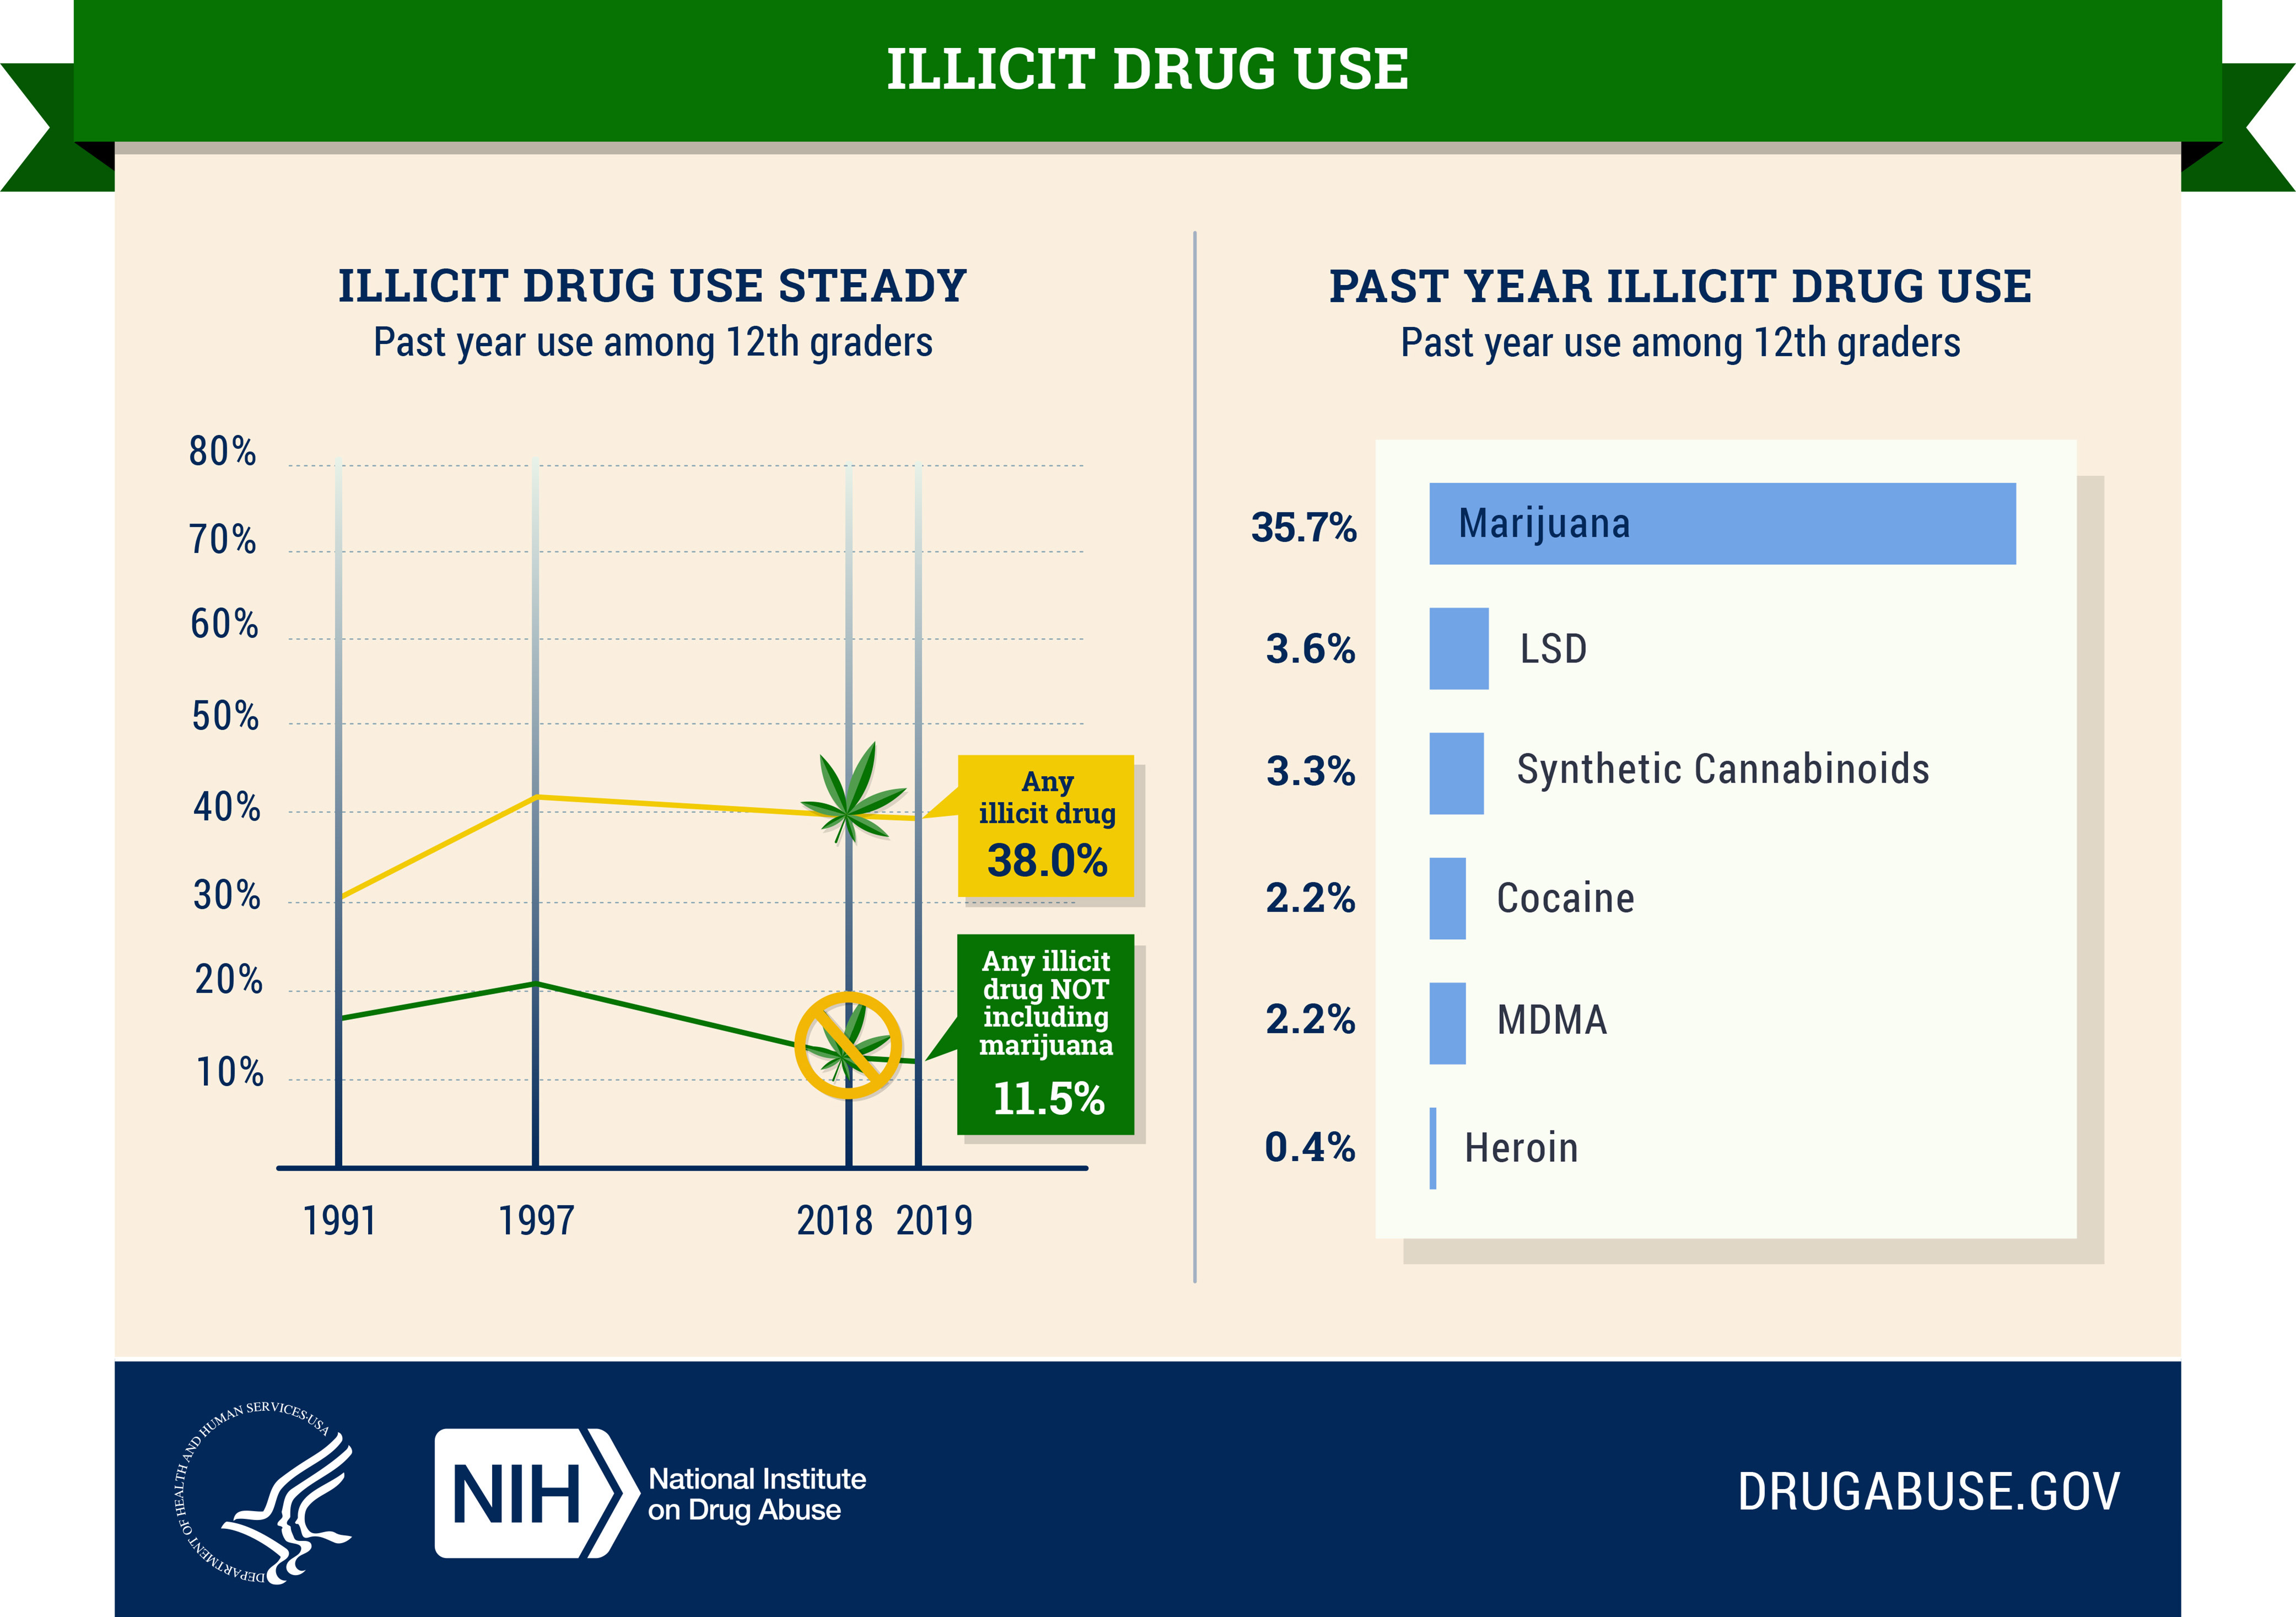
Figure 1. Illicit Drug Use
Past year use of illicit drugs among 12th graders remained steady.
Any illicit drugs 38%
Illicit drugs not including marijuana 11.5%
Past year use of illicit drugs:
Marijuana 35.7%
LSD 3.6%
Synthetic Cannabinoids 3.3%
Cocaine 2.2%
MDMA 2.2%
Heroin 0.4%
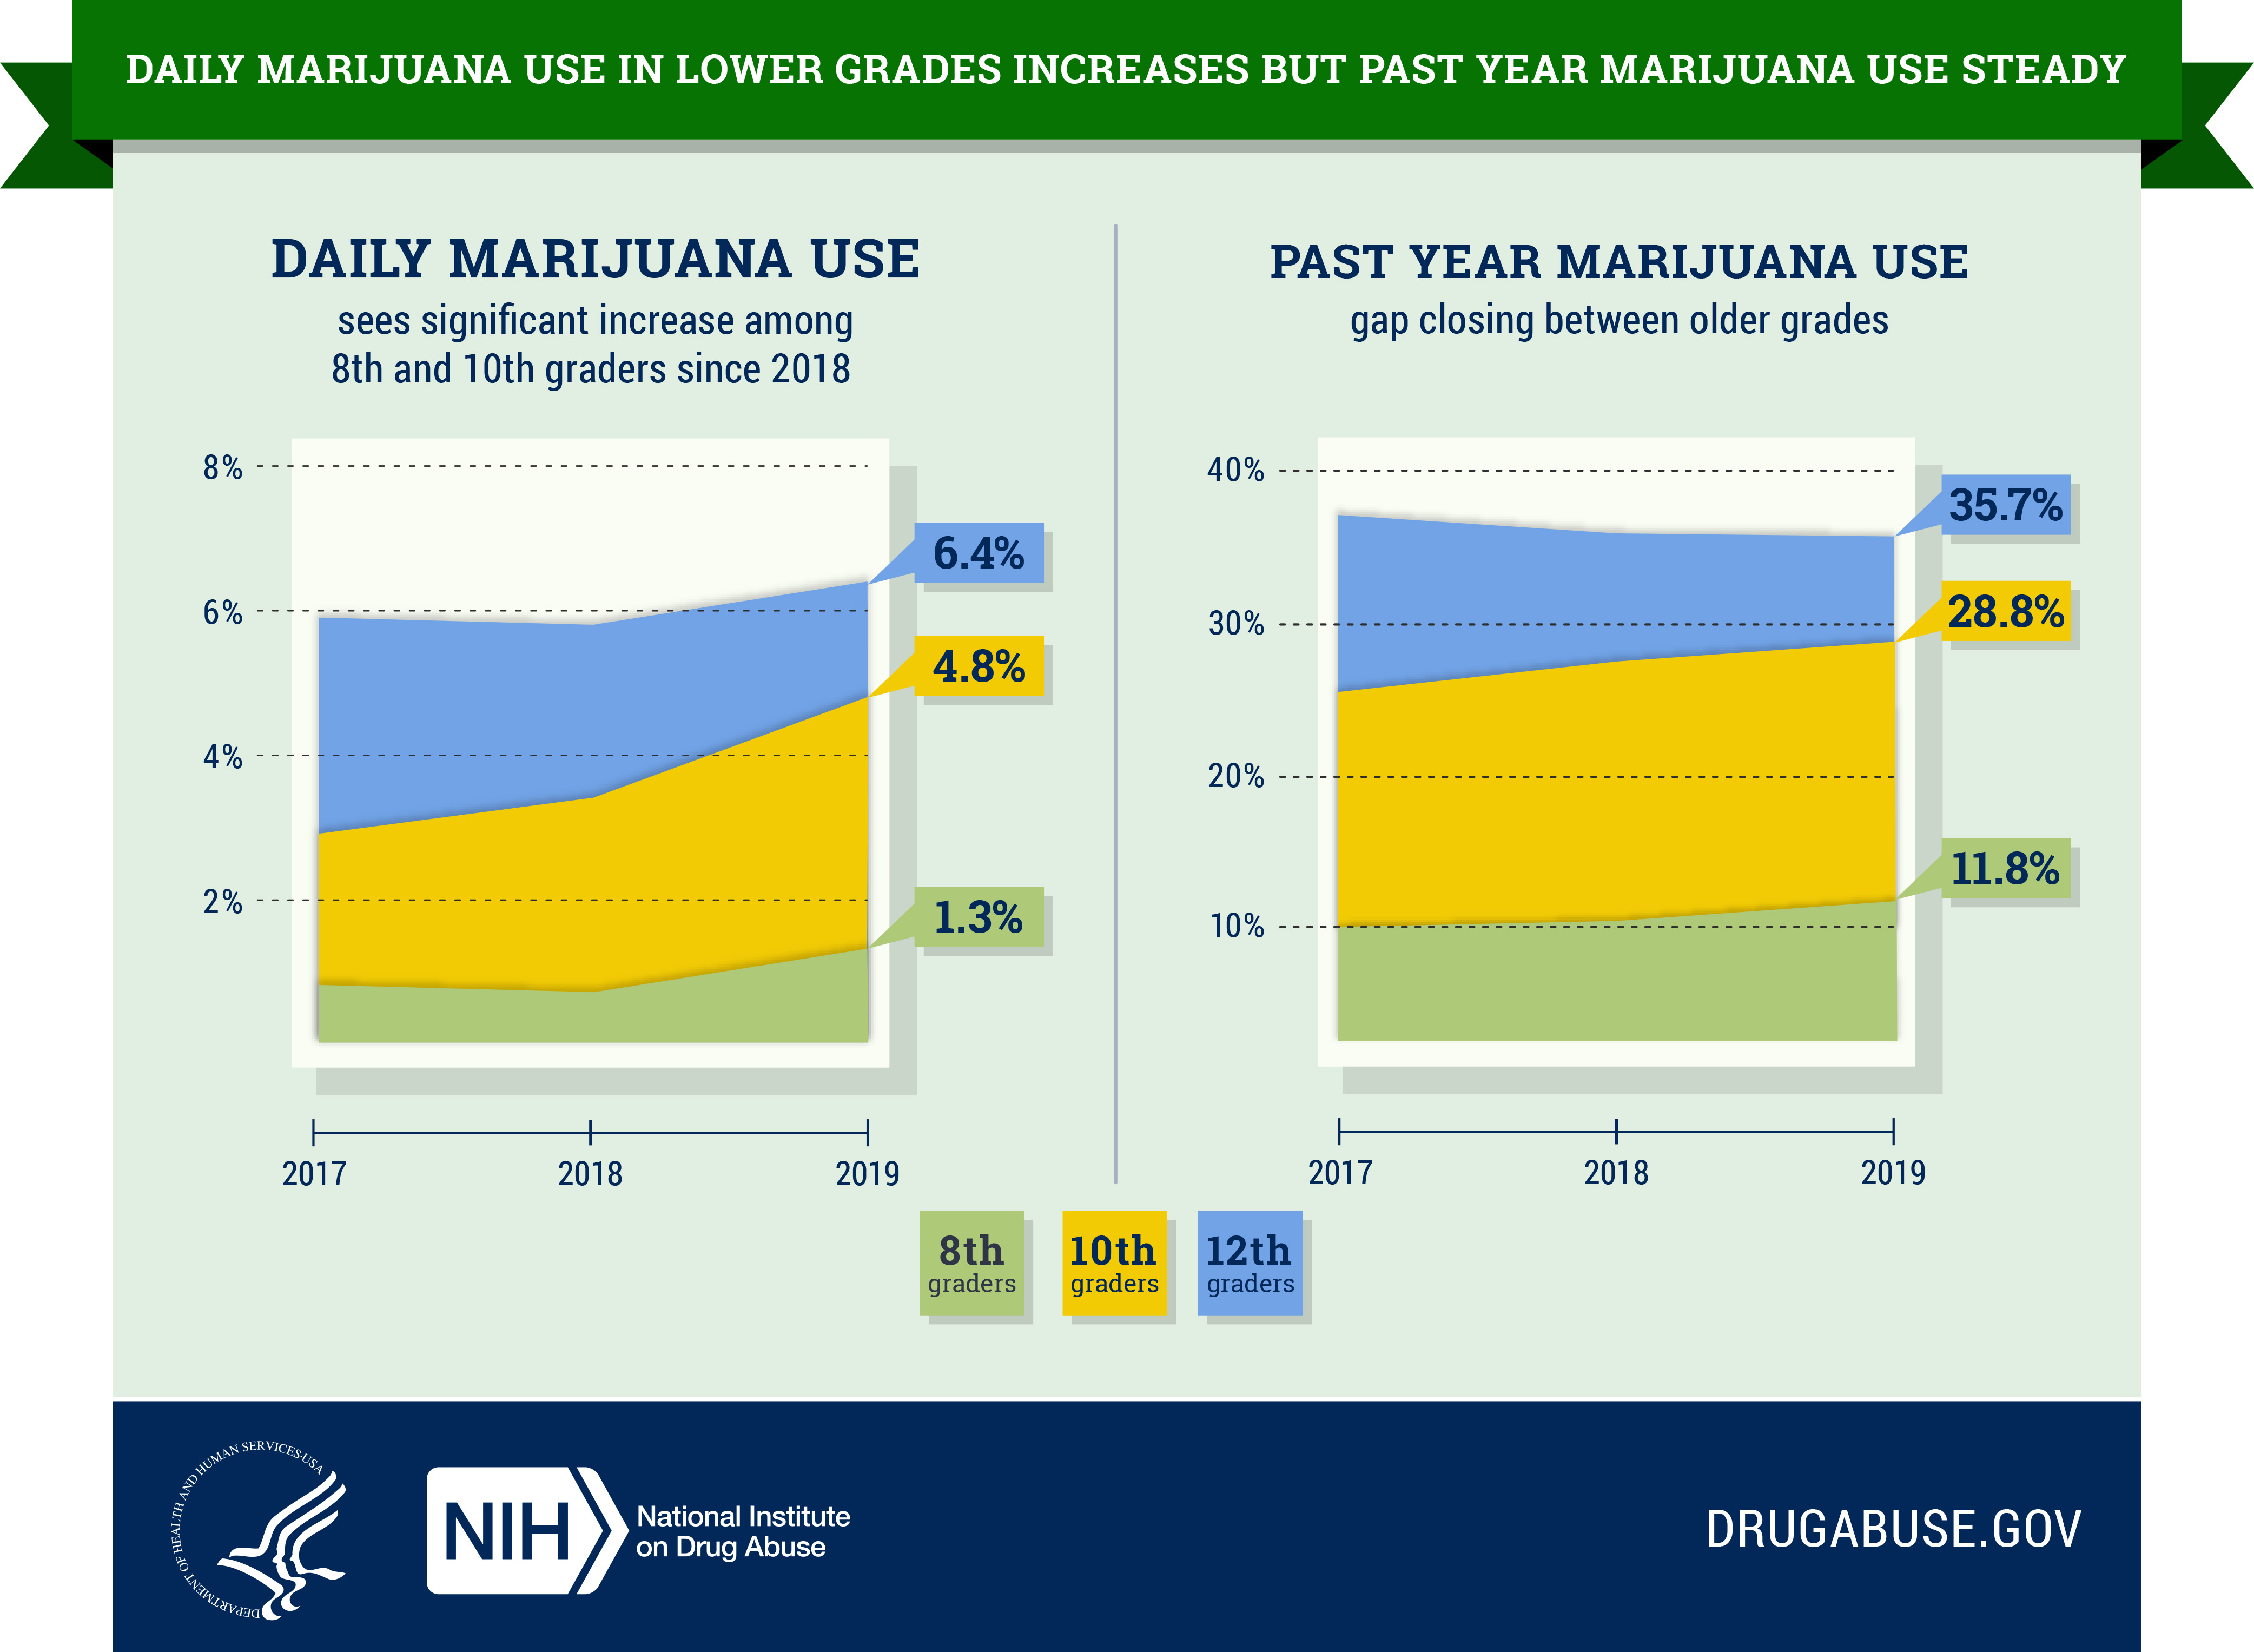
Figure 2. Daily Marijuana Use in Lower Grades Increases But Past Year Marijuana Use Steady
Both 8th and 10th graders reported significant increase in daily marijuana use between 2018 and 2019.
2018 Daily Marijuana Use
8th grade 0.7%
10th grade 3.4%
12th grade 5.8%
2019 Daily Marijuana Use
8th grade 1.3%
10th grade 4.8%
12th grade 6.4%
Past year marijuana use – gap closing between older grades
8th grade 11.8%
10th grade 28.8%
12th grade 35.7%
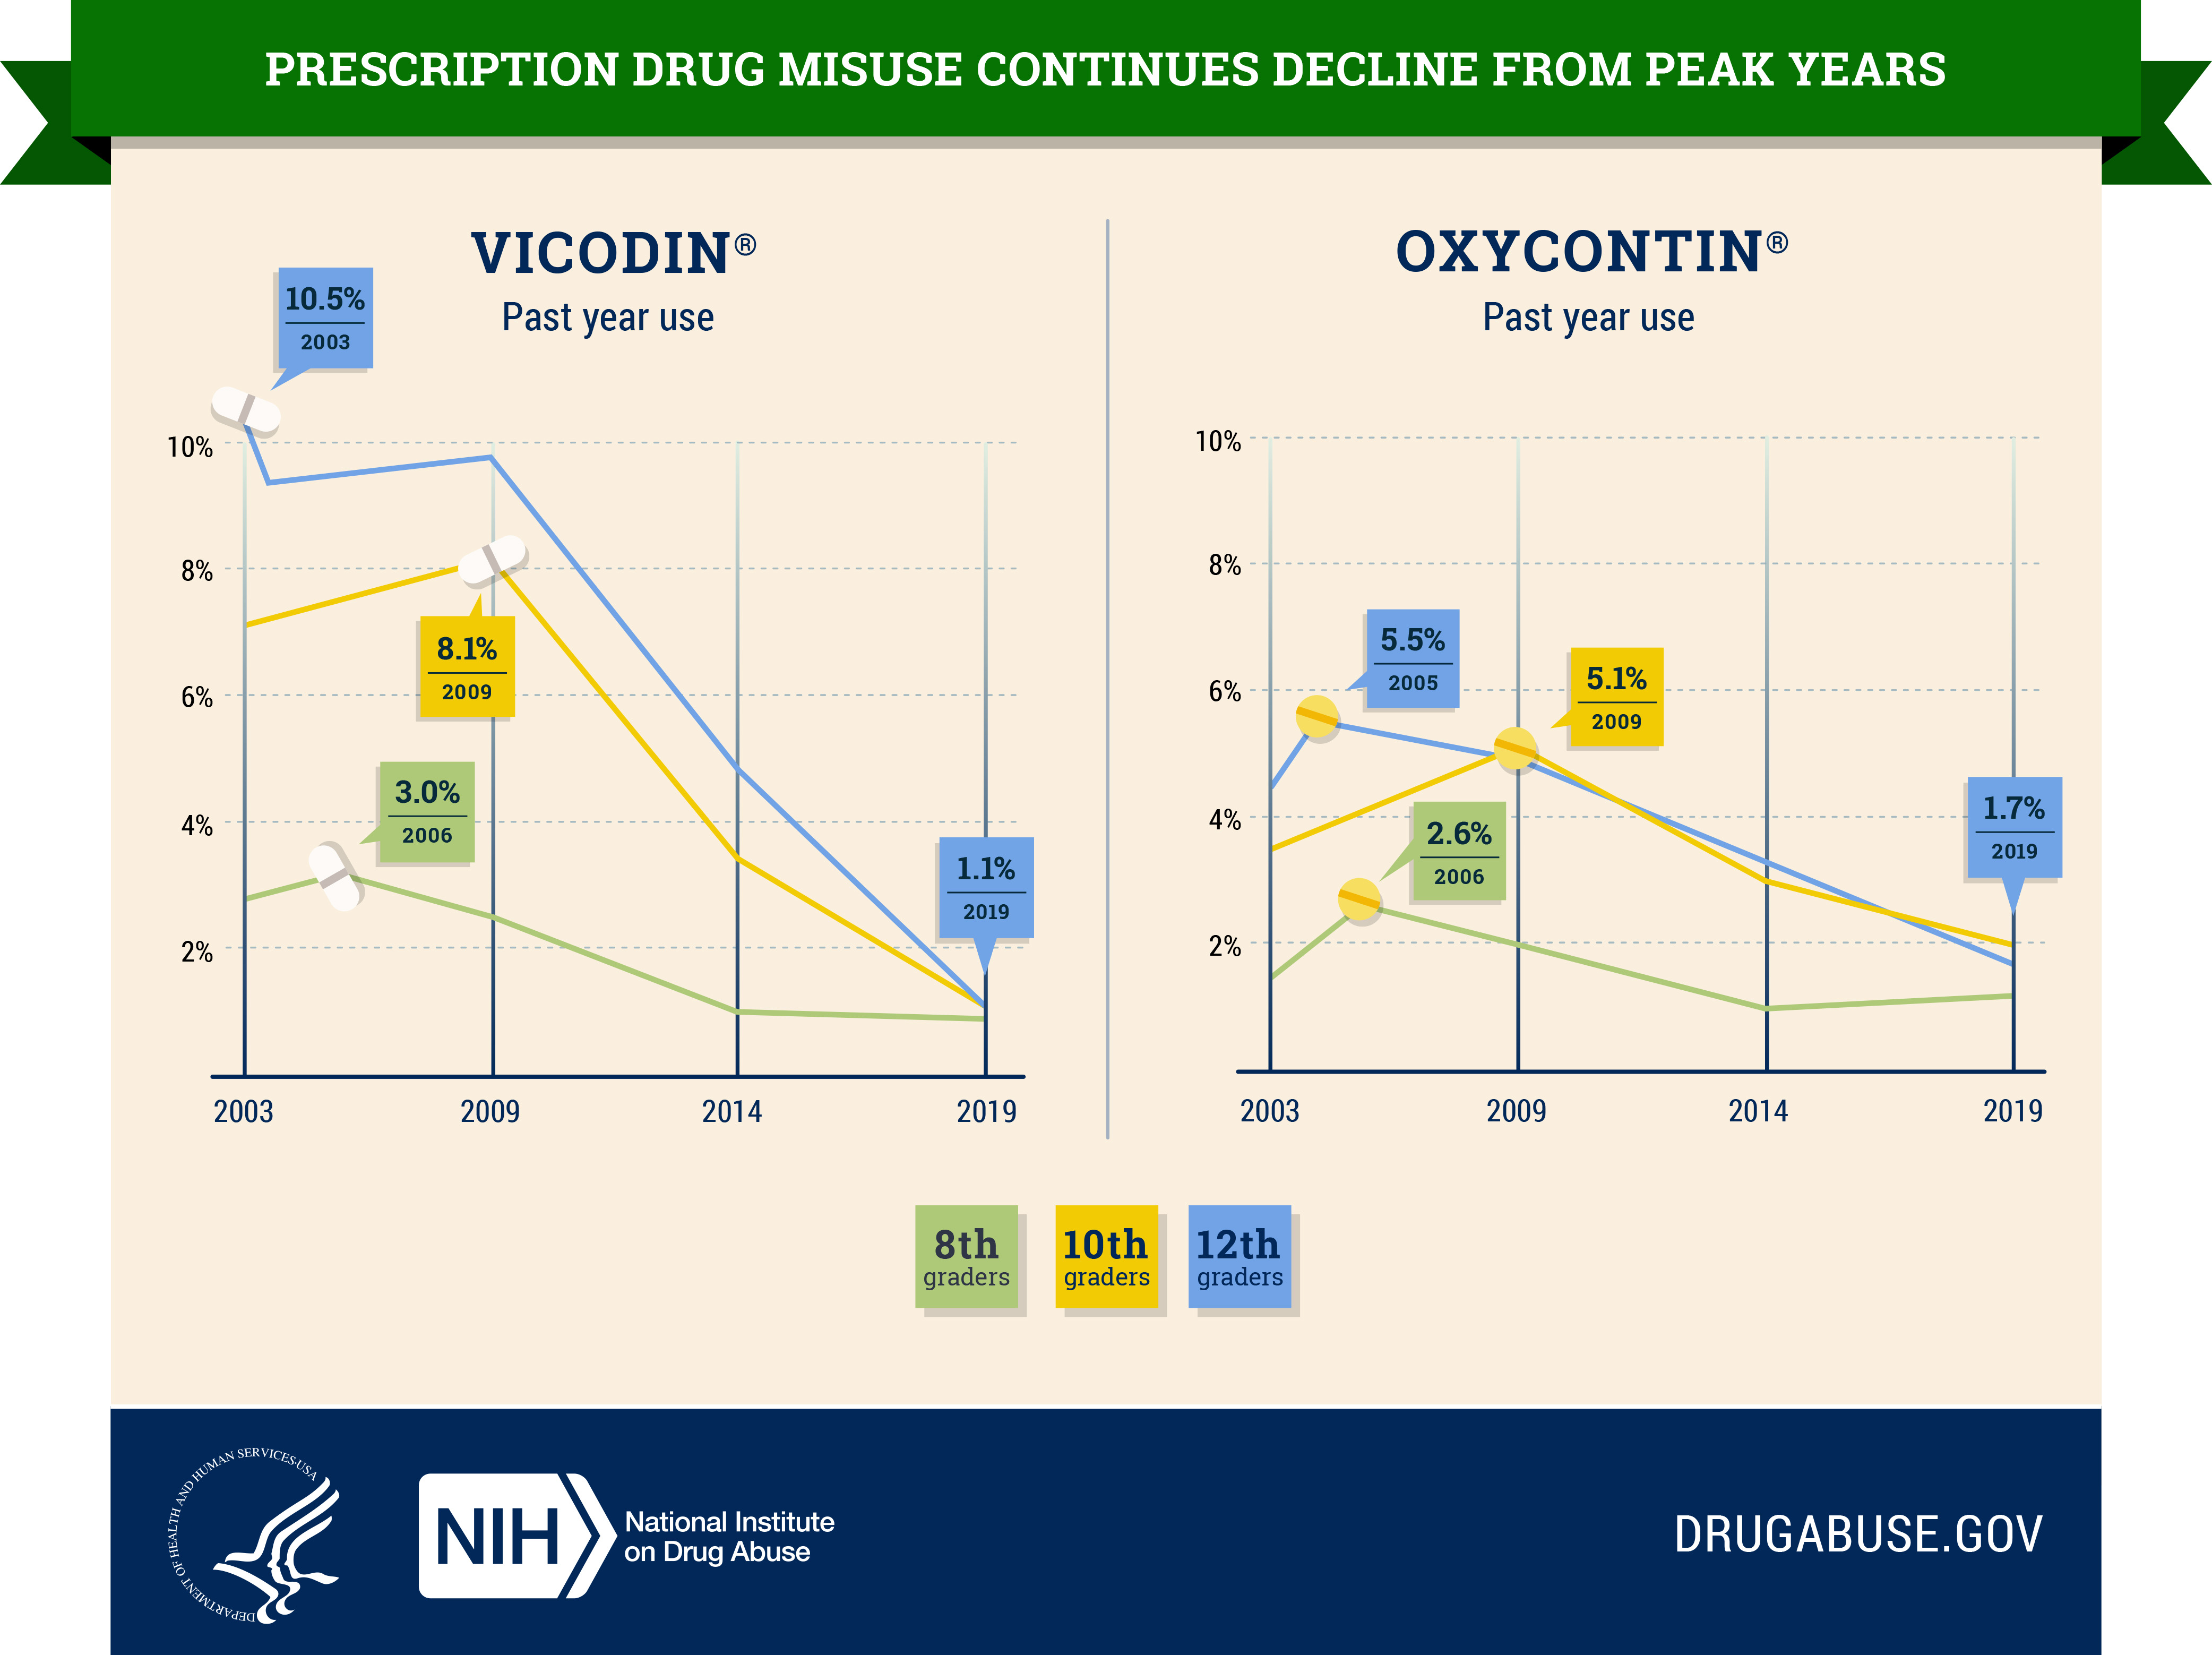
Figure 3. Prescription Drug Misuse Continues Decline from Peak Years
Vicodin®
Peak Years
8th grade: 3.0% (2006)
10th grade: 8.1% (2009)
12th grade: 10.5% (2003)
2019
8th grade 0.9%
10th grade 1.1%
12th grade 1.1%
Oxycontin®
Peak Years
8th grade: 2.6% (2006)
10th grade: 5.1% (2009)
12th grade: 5.5% (2005)
2019
8th grade 1.2%
10th grade 2.0%
12th grade 1.7%
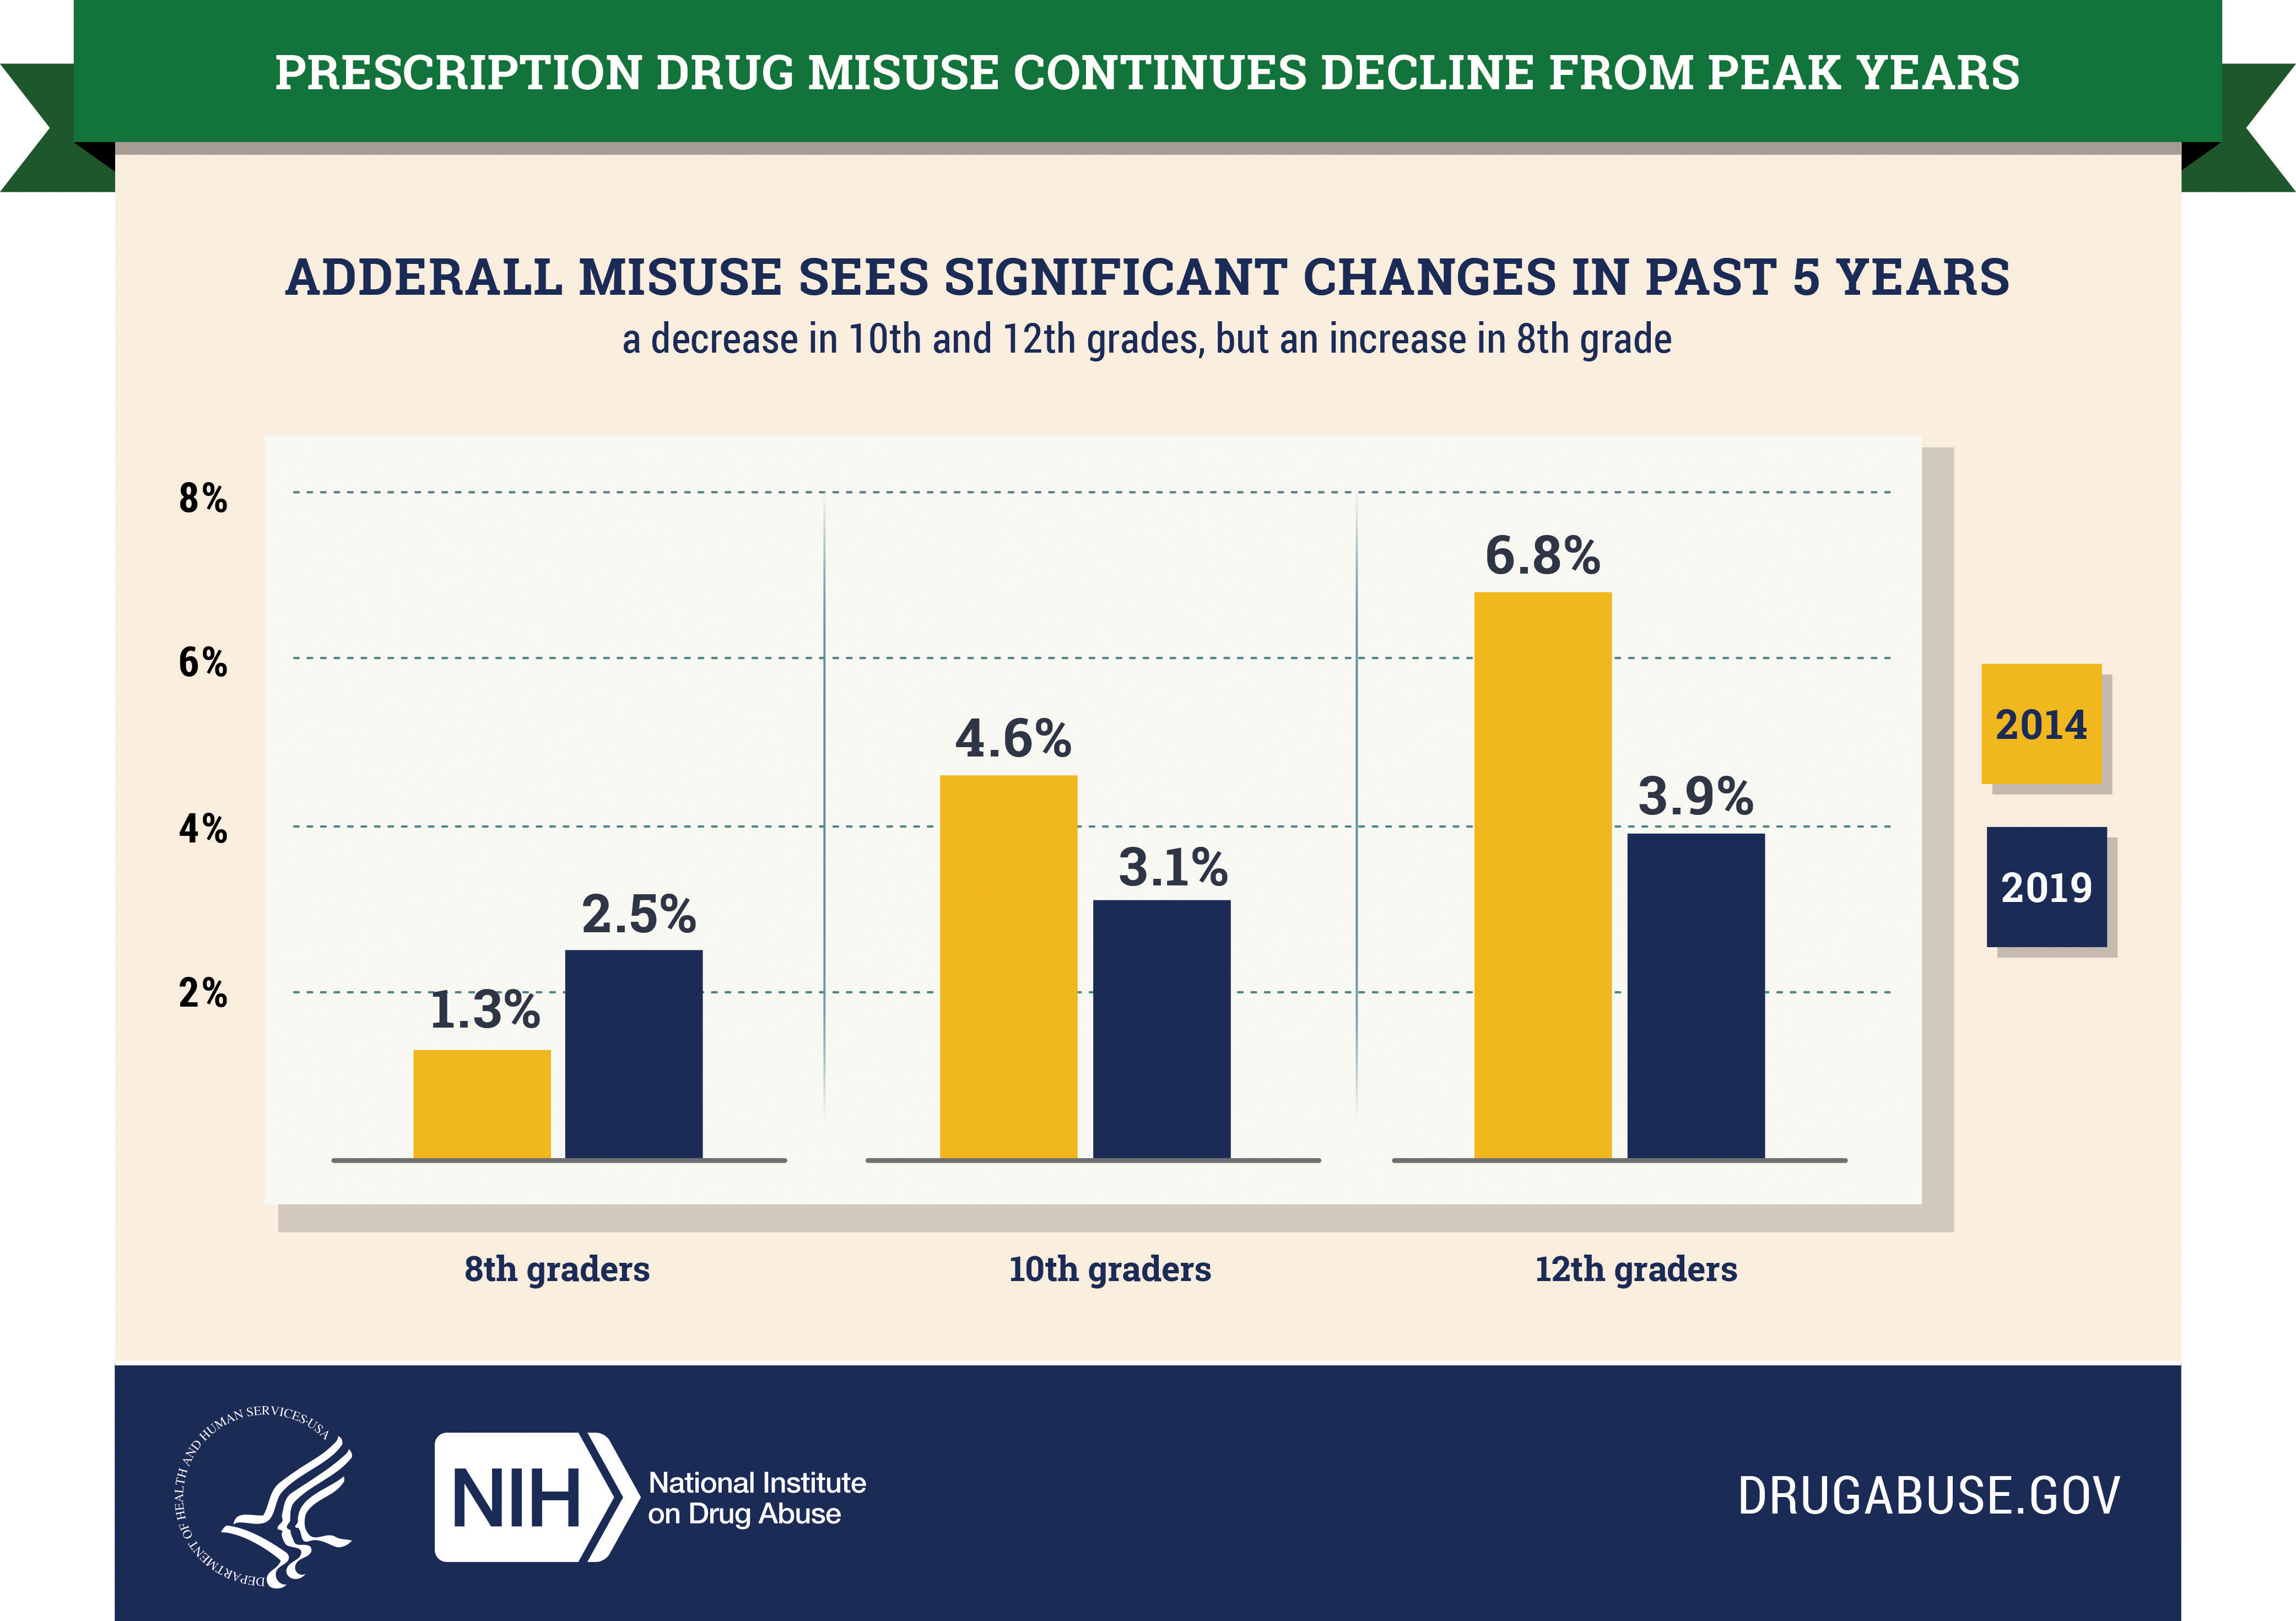
Adderall® Misuse Sees Significant Changes in Past 5 Years
Decrease in 10th and 12th grades but an increase in 8th grades
2014
8th grade 1.3%
10th grade 4.6%
12th grade 6.8%
2019
8th grade 2.5%
10th grade 3.1%
12th grade 3.9%
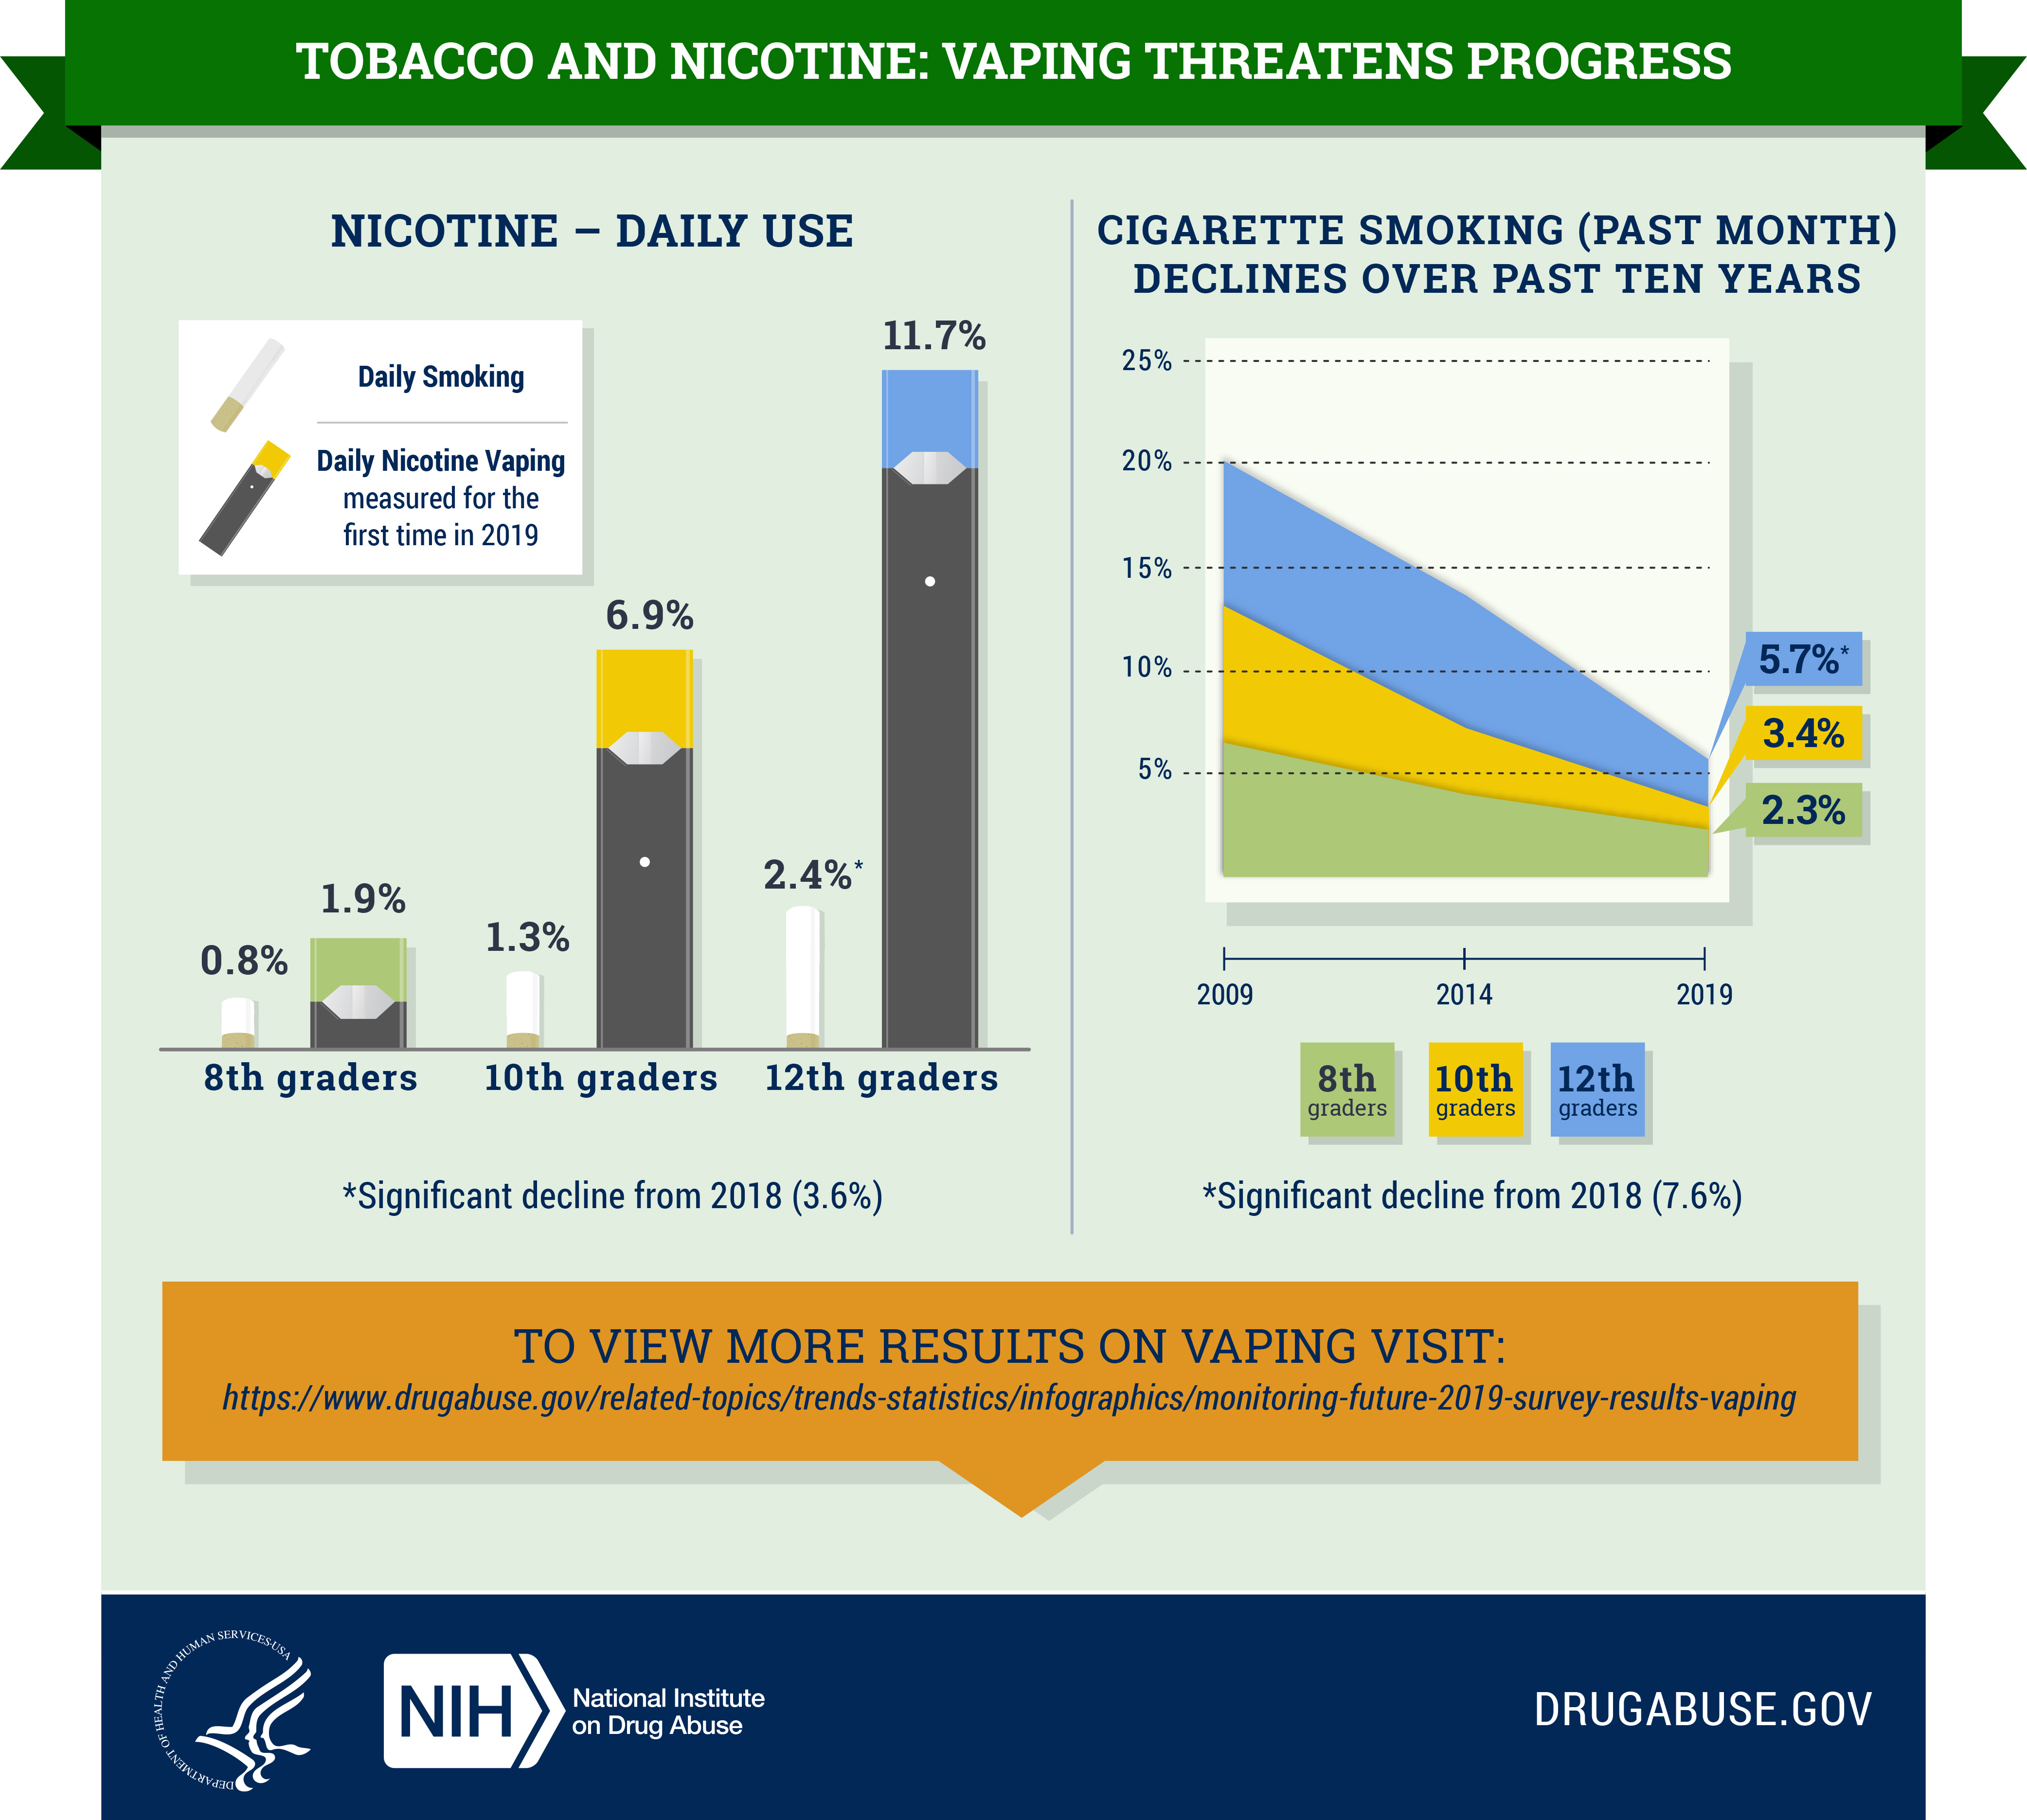
Figure 4. Tobacco and Nicotine: Vaping Threatens Progress
Nicotine – Daily Use
Daily Smoking
8th grade 0.8%
10th grade 1.3%
12th grade 2.4%*
*Significant decline from 2018 (3.6%)
Daily Nicotine Vaping
8th grade 1.9%
10th grade 6.9%
12th grade 11.7%
Cigarette Smoking (Past Month) Declines Over Past Ten Years
8th grade 2.3%
10th grade 3.4%
12th grade 5.7%*
*Significant decline from 2018 (7.6%)
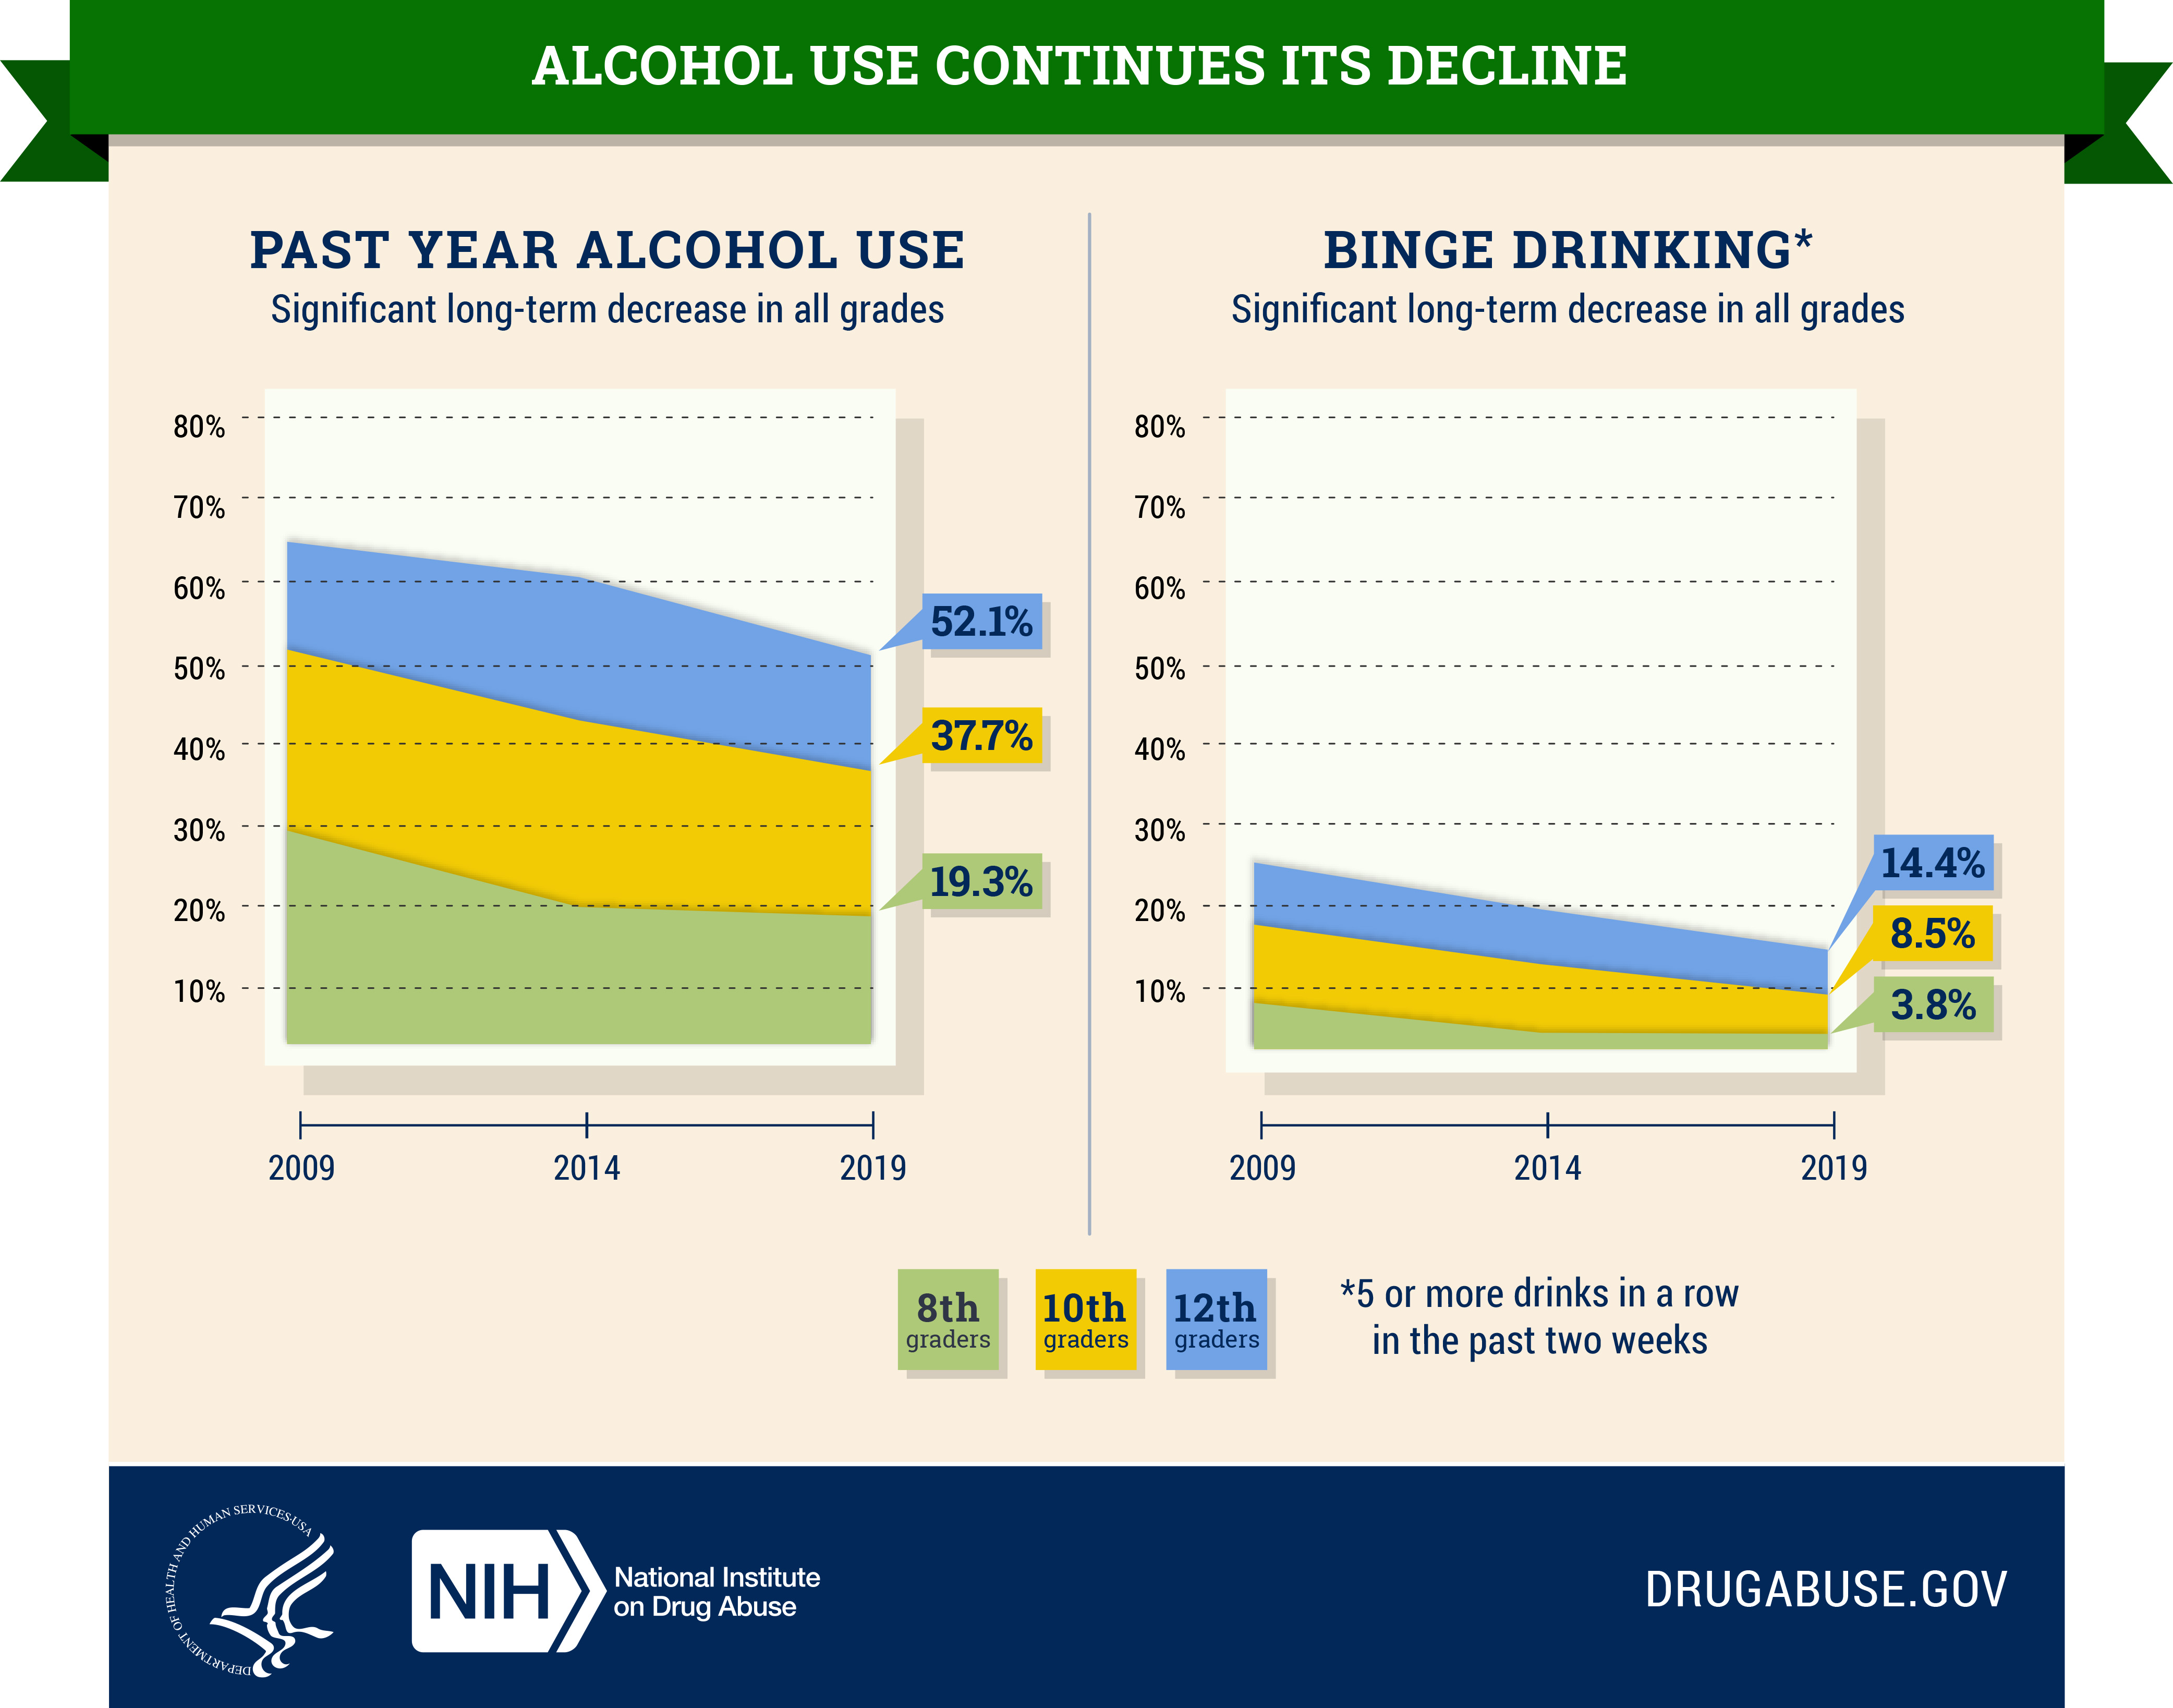
Figure 5. Alcohol Use Continues to Decline
Significant Long-Term Decrease in All Grades
2019
8th grade 19.3%
10th grade 37.7%
12th grade 52.1%
Binge Drinking* Significant Long-Term Decrease in All Grades
2019
8th grade 3.8%
10th grade 8.5%
12th grade 14.4%
*5 or more drinks in a row in the past two weeks
For more information on MTF 2019 Survey findings specific to Vaping: archives.nida.nih.gov/related-topics/trends-statistics/infographics/monitoring-future-2019-survey-results-vaping
This publication is available for your use and may be reproduced in its entirety without permission from NIDA. Citation of the source is appreciated, using the following language: Source: National Institute on Drug Abuse; National Institutes of Health; U.S. Department of Health and Human Services.