This research:
- Adds to research showing that nicotine and cannabis have interactive effects on brain structure and function.
- Suggests that specialized treatment interventions may be appropriate for people who use both drugs.
A recent NIDA-supported study underlines the fact that drugs used in combination can produce effects that differ from the sum of the drugs' individual effects. Researchers showed that users of either nicotine or cannabis had reduced connectivity in several brain networks, but that users of both drugs had connectivity similar to that of users of neither.
Dr. Francesca Filbey of the Center for Brain Health at the University of Texas, Dallas, and Dr. Bharat Biswal of the New Jersey Institute of Technology conducted resting state functional magnetic resonance imaging (rsfMRI) to assess network connectivity in 28 nicotine users, 53 cannabis users, 26 users of both drugs, and 30 nonusers. In rsfMRI, subjects are asked to relax and let their minds wander during imaging. A network's connectivity when it is at rest provides a baseline indicator of how well its component regions may coordinate when called upon to respond to environmental stimuli or challenges.
The fMRI images revealed that nicotine and cannabis users each had reduced connectivity compared with nonusers in two networks, including one that supports salience (assigning importance to environmental stimuli) (see Figure 1). The nicotine users also had reduced connectivity in seven additional networks that support functions including cognition, vision, and bodily awareness. Users of both drugs had connectivity comparable to nonusers in all networks; greater than users of only nicotine or only cannabis in six networks; and greater connectivity than users of only nicotine but not users of only cannabis in four additional networks (see Figure 2).
Dr. Filbey summarizes, "Functional connectivity across multiple brain regions suffers when using nicotine or when using cannabis, but connectivity of those who use both substances together resembles that of nonusers." She says the new findings accord with suggestions that nicotine's cognition-enhancing effects may facilitate cannabis use by counteracting cannabis' negative impact on networks supporting cognition.
The new study adds to others that demonstrate multiple individual and complex interactive effects of nicotine and cannabis on brain structure and function. In previous studies, Dr. Filbey and colleagues showed that regular marijuana use reduces gray matter volume in the orbitofrontal cortex, and that the exposure to both nicotine and cannabis inverts the normal association between greater hippocampus volume and stronger memory performance.
Dr. Filbey hopes that elucidating nicotine–cannabis interactions ultimately will lead to more effective treatment interventions for people who use both drugs, which is an estimated 39 percent of cannabis users.
Dr. Filbey says, "These findings illustrate that there are complex interactions at work between nicotine and cannabis. While we know these two substances have overlapping effects, there is a lot we don't know about these interactions. It is clear, however, that understanding how the brain reacts to nicotine and cannabis has important implications for treatment."
This study was supported by NIH grants DA021632, DA030344-01A1, and DA038895.
- Caption and text description of Figure 1
-
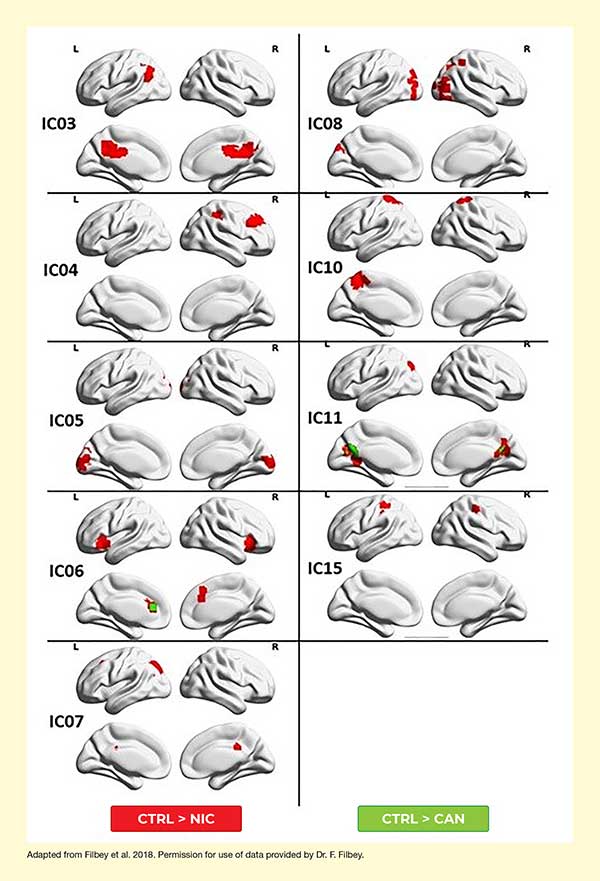
Caption - Nonusers of both drugs (CTRL) exhibited greater connectivity than users of either drug in the IC06 network, which mediates salience, and the IC11 network in the posterior cingulate gyrus. Nonusers also had greater connectivity than nicotine users in most of the other observed networks
Text Description - The figure illustrates differences in resting state functional connectivity between users of nicotine only, users of cannabis only, and nonusers in nine brain networks. Each brain network is represented by one panel showing four brain illustrations. The two top illustrations in each panel represent lengthwise outside view of the left and right side of the brain. The two bottom illustrations in each panel represent lengthwise cross-sections of the left and right side of the brain. Areas highlighted in red indicate that resting state functional connectivity is higher in nonusers (CTRL) than in nicotine users, and areas highlighted in green indicate that resting state functional connectivity is higher in nonusers than in cannabis users.
The left panel in the top row, representing the IC03 network, has red areas in the top left, bottom left, and bottom right brain illustrations. The right panel in the top row, representing the IC08 network, has red areas in the top left, top right, and bottom left brain illustrations.
The left panel in the second row, representing the IC04 network, has red areas in the top right brain illustration. The right panel in the second row, representing the IC10 network, has red areas in the top left, top right, and bottom left brain illustrations.
The left panel in the third row, representing the IC05 network, has red areas in the bottom left and bottom right brain illustrations. The right panel in the third row, representing the IC11 network, has red areas in the top left, bottom right, and bottom left brain illustrations, as well as a smaller green area next to the red area in the bottom left brain illustration.
The left panel in the fourth row, representing the IC06 network, has red areas in all four brain illustrations, as well as a green area overlapping the red area in the bottom left brain illustration. The right panel in the fourth row, representing the IC15 network, has red areas in the top left and top right brain illustrations.
The left panel in the bottom row, representing the IC07 network, has red areas in the top left, bottom left, and bottom right brain illustrations.
- Caption and text description of Figure 2
-
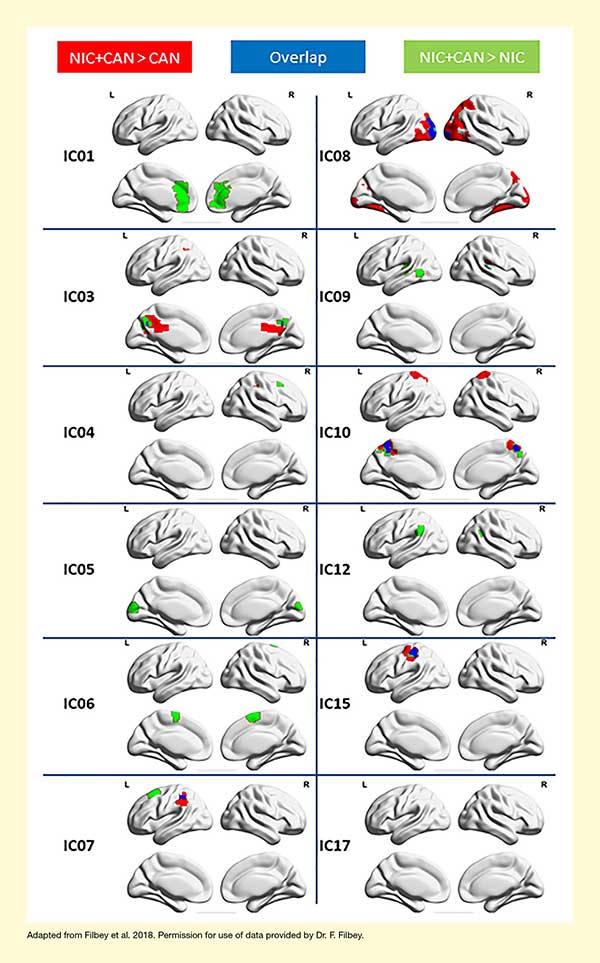
Caption - Users of both drugs had greater connectivity than users of only nicotine or only cannabis in six networks (IC03, IC04, IC07, IC08, IC10, and IC15) and greater connectivity than users of only nicotine in four additional networks (IC01, IC05, IC06, and IC09).
Text Description - The figure illustrates differences in resting state functional connectivity between users of nicotine only, users of cannabis only, and concurrent nicotine and cannabis users in 12 brain networks. Each brain network is represented by one panel showing four brain illustrations. The two top illustrations in each panel represent lengthwise outside view of the left and right side of the brain. The two bottom illustrations in each panel represent lengthwise cross-sections of the left and right side of the brain. Areas highlighted in red indicate that resting state functional connectivity is higher in concurrent nicotine and cannabis users than in cannabis-only users, areas highlighted in green indicate that resting state functional connectivity is higher in concurrent nicotine and cannabis users than in nicotine-only users, and areas highlighted in blue indicate that there is an overlap—that is, that resting state functional connectivity is higher in concurrent cannabis and nicotine users than in both cannabis-only and nicotine-only users.
The left panel in the top row, representing the IC01 network, has green areas in the bottom left and bottom right brain illustrations. The right panel in the top row, representing the IC08 network, has red areas in all four brain illustrations as well as a blue area in the top left brain illustration.
The left panel in the second row, representing the IC03 network, has red areas in the top left, bottom left, and bottom right brain illustrations, as well as green areas in the bottom left and bottom right brain illustrations. The right panel in the second row, representing the IC09 network, has a green area in the top left brain illustration.
The left panel in the third row, representing the IC04 network, has a red area and a green area in the top right brain illustration. The right panel in the third row, representing the IC10 network, has red areas in all four brain illustrations, as well as green and blue areas in the bottom left and bottom right brain illustrations.
The left panel in the fourth row, representing the IC05 network, has green areas in the bottom left and bottom right brain illustrations. The right panel in the fourth row, representing the IC12 network, has green areas in the top left and top right brain illustrations.
The left panel in the fifth row, representing the IC06 network, has green areas in the bottom left and bottom right brain illustrations. The right panel in the fifth row, representing the IC15 network, has red, green, and blue areas in the top left brain illustration.
The left panel in the bottom row, representing the IC07 network, has red, green, and blue areas in the top left brain illustration. The right panel in the bottom row, representing the IC17 network, has no colored areas.
Source:
- Filbey, F.M., Gohel, S., Prashad, S., et al. Differential associations of combined vs. isolated cannabis and nicotine on brain resting state networks. Brain Structure and Function 223(7):3317-3326, 2018.