
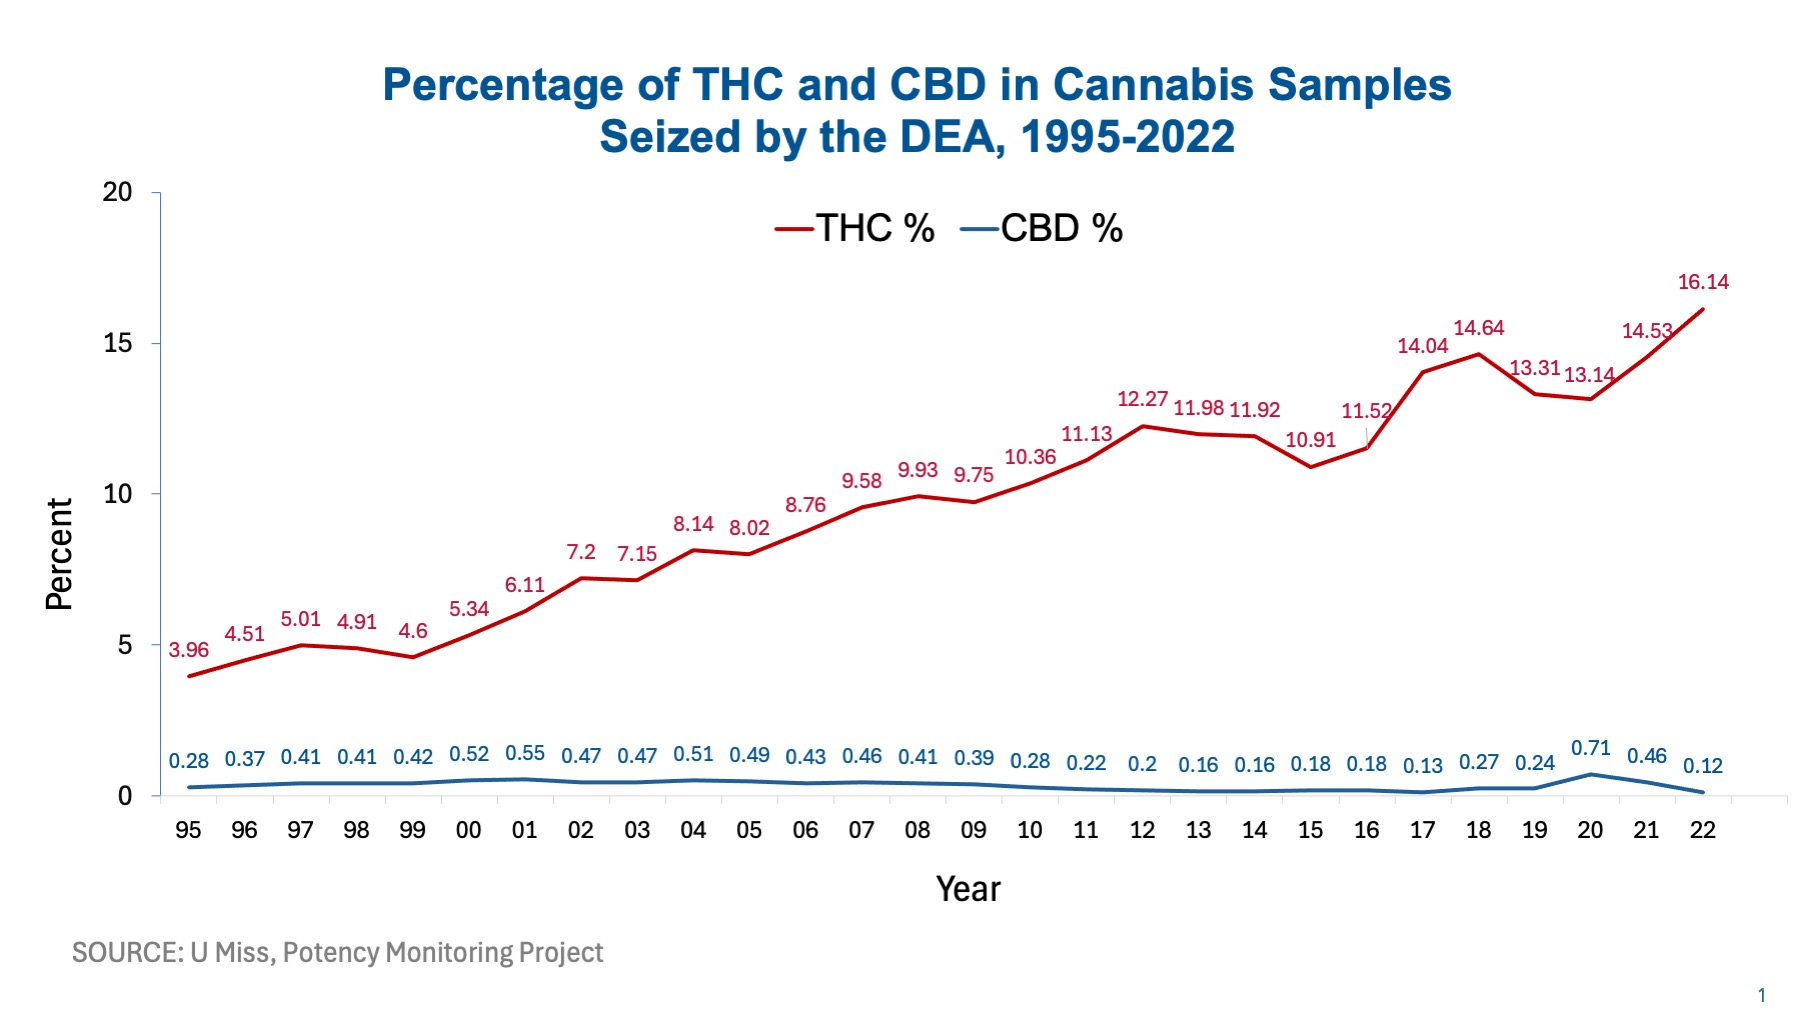
Under contract with NIDA, the National Center for Natural Products Research (NCNPR) located at the University of Mississippi (UM), conducts analyses to monitor the potency of cannabis products distributed in the illegal marijuana marketplace in the United States. Samples are submitted for analysis by the Drug Enforcement Administration (DEA) and by state and local police agencies. Samples tested in the laboratory are classified into one of three categories: cannabis (plant material), hashish (dried resin), and hash oil (cannabis extract). Each sample is analyzed by gas chromatography for the major psychotropic component, delta-9-tetrahydrocannabinol (THC), as well various cannabinoids, including cannabidiol (CBD). The data below reflect the percentage of THC and CBD in the cannabis samples seized by the DEA from 1995-2022.
- Tabular Data
Percentage of THC and CBD in the Cannabis Samples Seized by the DEA from 1995-2022 Year No. of Samples THC % CBD % 1995 3,763 3.96 0.28 1996 1,402 4.51 0.37 1997 1,337 5.01 0.41 1998 1,341 4.91 0.41 1999 1,825 4.6 0.42 2000 1,929 5.34 0.52 2001 1,687 6.11 0.55 2002 1,690 7.2 0.47 2003 1,872 7.15 0.47 2004 1,914 8.14 0.51 2005 2,295 8.02 0.49 2006 2,081 8.76 0.43 2007 2,143 9.58 0.46 2008 2,000 9.93 0.41 2009 2,073 9.75 0.39 2010 2,261 10.36 0.28 2011 2,342 11.13 0.22 2012 2,100 12.27 0.20 2013 1,230 11.98 0.16 2014 971 11.92 0.16 2015 1,003 10.91 0.18 2016 829 11.52 0.18 2017 781 14.04 0.13 2018 815 14.64 0.27 2019 484 13.31 0.24 2020 670 13.14 0.71 2021 432 14.53 0.46 2022 351 16.14 0.12 Delta-9-tetrahydrocannabinol (THC) and Cannabidiol (CBD) Potency of Cannabis Samples Seized by the Drug Enforcement Administration (DEA), Percent Averages from 1995-2022 Source: Potency Monitoring Program, NIDA Contract Number: N01DA-15-7793